K-W-L Strategy Chart
Definition:
|
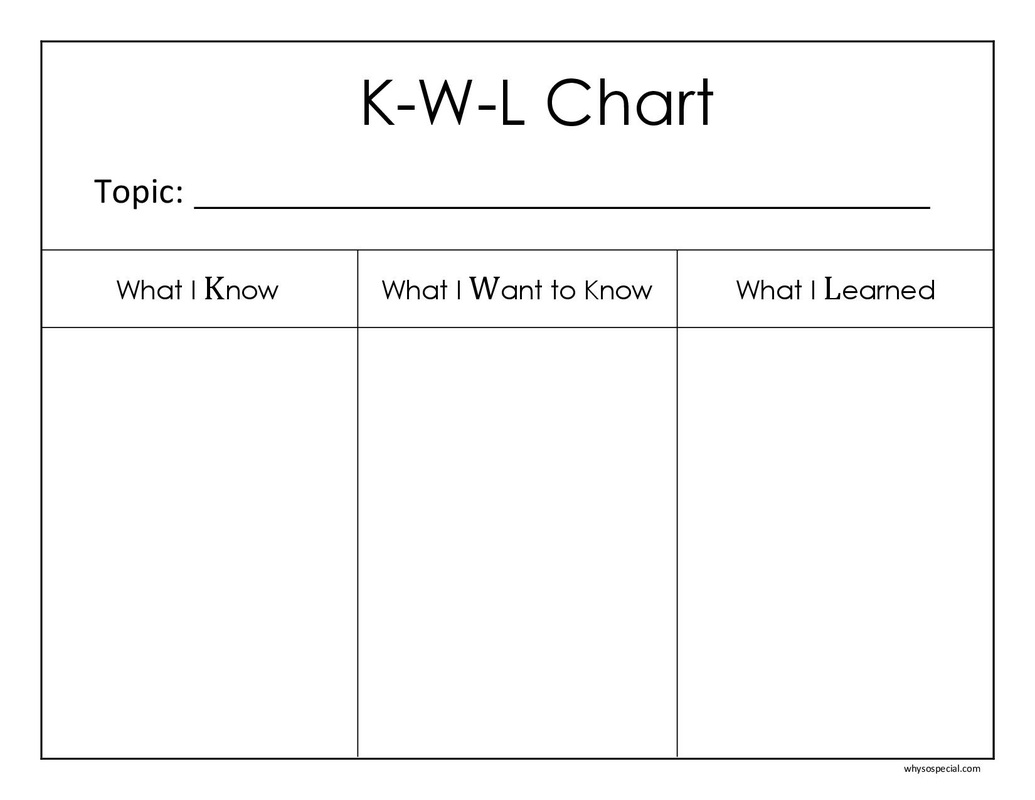
The K-W-L Strategy Chart is a graphic organizer designed to aid in student comprehension (https://en.wikipedia.org/wiki/KWL_table). The purpose of the K-W-L chart is to activate the student's prior learning about a topic (Miller & Veatch, 2012). It also gives them a purpose while reading the text and helps them monitor their comprehension (2012). This strategy can be used as a whole group strategy, in small groups, or individually. Paper is divided into three sections or columns. The first column, 'K', is for what the students already know about a topic. This step is to be completed before the reading. The next column, 'W', is for students to list what they want to learn about the topic during the reading. This step is also to be completed before the reading. The third column, 'L', is for what the students learned from the reading. This step, of course, is done after finishing the reading (https://en.wikipedia.org/wiki/KWL_table)
How it works (Miller & Veatch, 2012):
|
How I will use a K-W-L chart:
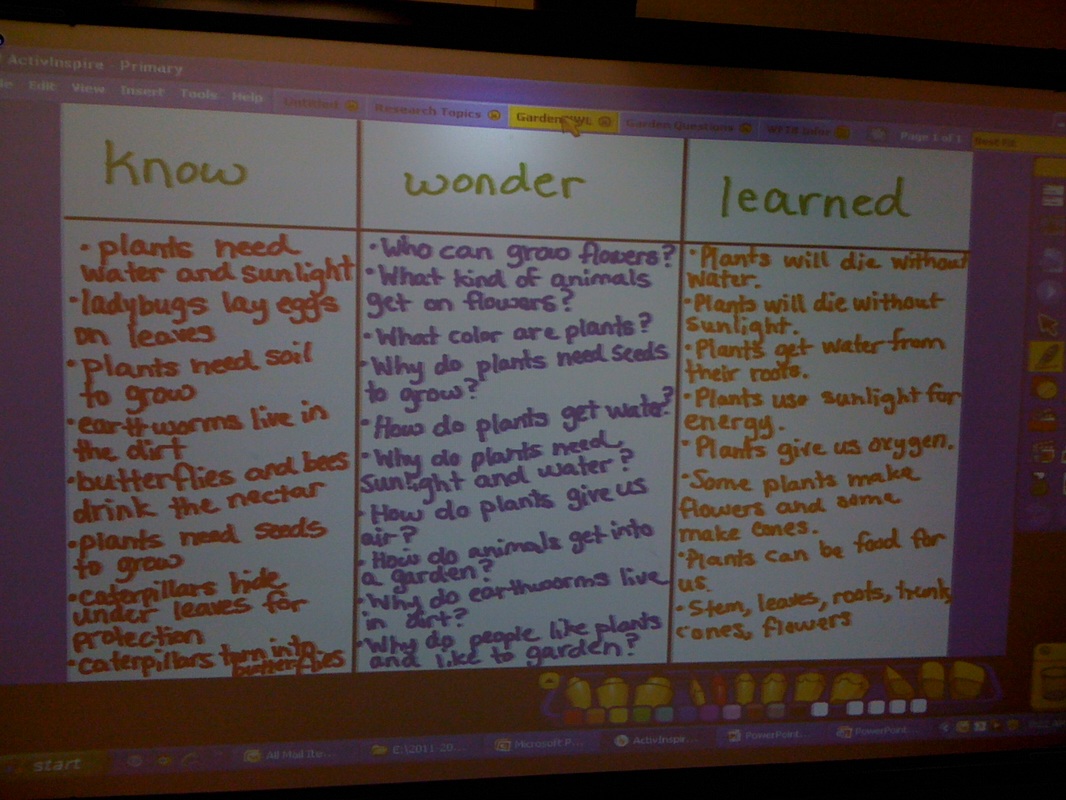
I provided a blank template above and also K-W-L chart that has been filled out in a way I will use this as a science teacher. Not only is this an excellent way for students to gain more comprehension before reading a text but it is also a great way to activate their prior knowledge and thinking when introducing a new topic. In my science classrooms I can see using this method often before a lab to get the students thinking about the lab. For example:
- Before performing a lab on photosynthesis I would begin with this chart.
- Students tell me all of their prior knowledge of what they know about photosynthesis.
- In small groups, they come up with questions about what they WANT to know about photosynthesis. We share these as a whole group.
- In small groups, they take one of their questions about what they want to know about photosynthesis and they design an experiment that would help answer that question.
- At the end of the experiment they write down what they LEARNED and we share as a group.
Examples:
The above video shows a great example of how you can use a K-W-L chart to activate prior knowledge. The instructor in the video knows her students have basic prior knowledge in the three levels of government. She talks through that prior knowledge with them. As she wants them to learn about the three levels in a deeper and more meaningful way, she asks them what they WANT to know and records those questions under the "W". After learning more, they complete the "L" portion together. The teacher shows great instruction as it is clear she wants to activate prior knowledge, get her students invested in learning new ideas by asking them what they want to know, then completing together what they learned.
In the above video of a teacher using a K-W-L chart to study worms, the instruction is great as the teacher works with the students prior knowledge. She acknowledges that the students are "worm specialists in training" because they are still learning about worms. In that way, she encourages them to tell her all they know now about worms and come up with more questions about worms, activating both prior knowledge and critical thinking in her students. I think this video shows how a K-W-L chart really engages the students in the topic they are studying. It shows how they become invested in what they are learning because they are asking the question: What do I want to know and then looking for the answers.
Writing Component: Common Core English Language Arts Standards » Science & Technical Subjects » Grade 9-10 (http://www.corestandards.org/ELA-Literacy/RST/9-10/)
Looking at the Common Core standards for science in 9th and 10th grades (the grades I most often teach), I found the following standards would be met by using a K-W-L chart for comprehension in my classroom. In order to talk about what they learned the students would have to cite specific textual evidence to support their learning. During the reading they would be looking for central ideas or conclusions to answer what they want to learn. The entire process of completing the chart would be supporting their ability to determine the meaning of key terms and other phrases used relevant to science in 9-10 texts. While reading and looking for answers to what they want to learn, they will be analyzing the structure of relationships among texts and key terms. I will use the chart also before conducting experiments (or asking them to design experiments) and they will use the text as a support or contradiction of their own findings. Also, it will help them to read and comprehend texts.
- Cite specific textual evidence to support analysis of science and technical texts, attending to the precise details of explanations or descriptions.
- Determine the central ideas or conclusions of a text; trace the text's explanation or depiction of a complex process, phenomenon, or concept; provide an accurate summary of the text.
- Determine the meaning of symbols, key terms, and other domain-specific words and phrases as they are used in a specific scientific or technical context relevant to grades 9-10 texts and topics.
- Analyze the structure of the relationships among concepts in a text, including relationships among key terms (e.g., force, friction, reaction force, energy).
- Compare and contrast findings presented in a text to those from other sources (including their own experiments), noting when the findings support or contradict previous explanations or accounts.
- By the end of grade 10, read and comprehend science/technical texts in the grades 9-10 text complexity band independently and proficiently.
